
Speak naturally and state your intention
You do not need programming syntax or secret words to talk to Copilot. Say what you want, which market you are studying and what should remain unchanged. Verbs help express that intention: explain, compare, build, change, show, draw, open and run.
Start with a concrete request, then continue the conversation. “Make a perfect strategy” does not define a signal or a risk trade-off. “Help define a buy after price returns above a moving average, then ask what is missing” provides a workable direction.
The annotated screenshots use demo data. Numbered marks explain controls; example drawings and code illustrate the workflow rather than a recommendation or a measured compilation result. Screenshots can include French or English control labels.
Do I need to configure an AI before starting?
No. Keep Automatic and send your request from Home or chat. AI settings are optional: they let you deliberately choose a model, rather than activate agents. Expertise such as analyst or developer describes Copilot’s perspective.
The model choice is shared by chat and the code assistant. AI Lab and custom condition creation have separate preferences; Automatic is also available there. Feature access, your available allowance and service availability remain separate checks if a limit is reported.
The My preferences guide provides annotated screens and explains the differences between profile information, notifications, chat models and tool preferences.
Find the chat controls
Open the relevant strategy in Studio before requesting a change or a drawing on its chart. Check the name, symbol and timeframe. Review your message before sending it.
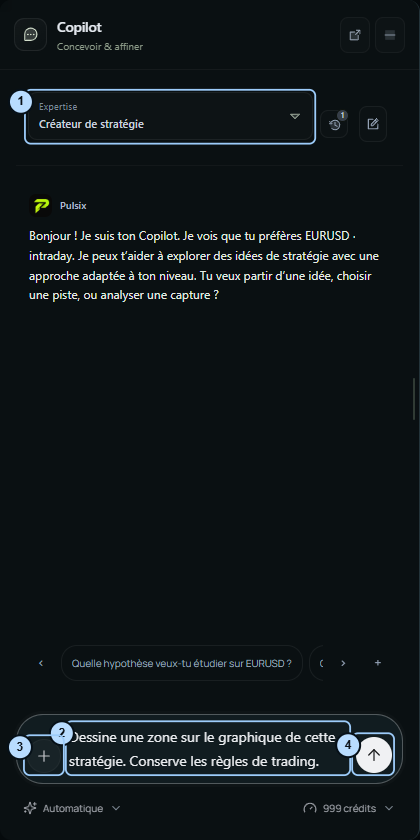
- Expertise: choose the relevant perspective, such as strategy creation or cTrader development.
- Message: state the action and settings to preserve.
- Attachment: add a screenshot when it supplies useful information.
- Send: send the request and inspect its status before repeating it.
Expertise frames a discussion; it does not replace a clear instruction. General explanations can begin in chat. Project-specific changes need the intended strategy selected.
Choose useful words
| What you need | Useful wording | What to check afterwards |
|---|---|---|
| Understand | Explain this rule without modifying the strategy | Does it match the displayed settings? |
| Explore | Suggest three hypotheses without applying them | Are signals and limitations distinct? |
| Build | Create a strategy from the following rules | Are entries, exits and protections defined? |
| Change | Replace only this parameter with this value | Were other settings preserved? |
| Draw | Draw this level or zone on the strategy chart | Are price and time references correct? |
| Display | Show this indicator without changing entries | Is the visual study configured correctly? |
| Prepare a test | Open backtest without running it | Data and costs still need review |
| Calculate | Run the backtest with the reviewed settings | Is a request and a new result available? |
Write a complete prompt
A useful prompt supplies context, action, constraints and the expected form of the answer. It does not need to be long. Adapt this template and remove unnecessary lines.
Context: I am studying [market], on [timeframe],
in strategy [name or version].
Objective: [explore / build / change / draw / analyse].
Relevant rule or element: [observable description and parameters].
Preserve: [entries, exits, risk, sessions or existing drawings].
Expected result: [explanation, targeted change, drawings or comparison].
If information is missing, ask a precise question before assuming it.
For analysis, identify the test and period. For a drawing, supply prices, dates or a method of choosing points. For a change, identify the value to replace.
Explore before creating
Ask for hypotheses before a complete strategy when you are still choosing an idea. Compare the behaviours and decide what you want to study.
I want to explore a strategy on EURUSD M15 without range breakouts.
Suggest three different hypotheses without modifying my current strategy.
For each: context, observable signal, exit, invalidation,
necessary data and main limitation.
Separate hypotheses from measured results.
A useful follow-up is: “Develop only the second idea. Define what a return inside the zone means. Do not build anything yet.” This is easier to review than combining exploration, coding and optimisation in one instruction.
Build through several exchanges
Use the first exchange to select a behaviour and the next to clarify it. Request construction when the rules suit your intention. The numbers below are illustrative.
First exchange: define
Help define a buy on EURUSD M15 after price returns above an EMA 20,
with context above an EMA 50. Use completed candles.
First list ambiguities about the signal and exit.
Second exchange: clarify
By return above I mean a previous close below EMA 20 followed by a close
above it. No short entries in this first version.
Suggest simple protection and explain its units before applying it.
Third exchange: build
Now create the strategy from the rules I have confirmed.
Use the protections I approved without adding other filters.
Summarise entries, exits, parameters and remaining checks.
Do not run a backtest yet.
Review Flow and strategy controls afterwards. Read both the response and the values actually retained by the strategy.
Change a setting without starting over
Name the setting and what must remain identical. “Make it safer” might mean smaller size, fewer signals or a different stop. Specify the change you want to measure.
On the selected strategy, change only the fast EMA period to 25.
Preserve the slow EMA, entry direction, sessions,
position size, stop and target.
Explain the difference without running a test.Request a level, zone or line
For a precise drawing, identify the shape, reference points, label and settings to preserve. Use explicit prices and times or identifiable points in the loaded data.
Draw a horizontal line at 1.1015 on this strategy chart,
labelled “Observation level”. This is a study reference:
do not create an order or change any rule. Preserve other annotations.Draw a rectangle from 1.1008 to 1.1018, spanning 1 July 2025
13:50 UTC to 1 July 2025 17:10 UTC. Label it “Study zone”.
Use a restrained fill and preserve trading rules.
If these dates are not in the loaded data, say so.Replace these illustrative coordinates with values present in your chart. If a mark is outside the visible window, check dates and the price scale before concluding it is missing.
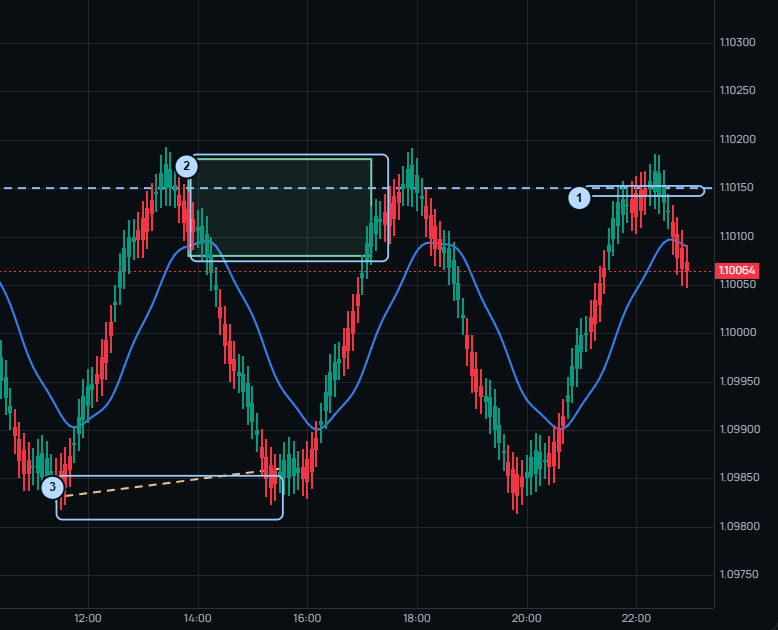
- Horizontal level: a price to observe.
- Zone: two price boundaries and a time span.
- Structure line: two points connected in their time context.
Request a market-based drawing
Instead of coordinates, describe how to choose the points. Define words such as “last”, “confirmed” and “important”.
Using the loaded data, connect the last two visible confirmed lows.
Explain how you identify them and add a short label.
If there are not two suitable points, say so.
Do not change entry conditions or protections.Add a Fibonacci retracement to the last identifiable upward move
in the displayed period. Identify the selected low and high before
interpreting the 0.382, 0.5 and 0.618 levels.
Use it for study; do not automatically add a trading condition.Identify a correction by label: “Move only ‘Observation level’ to 1.1020.” Name a drawing when requesting removal and preserve the others. Inspect what actually changed; editing options depend on drawing type and available context.
Other drawing requests
| Need | Example request | Details to supply |
|---|---|---|
| Previous day's high and low | Draw the two levels from the previous day | Reference day and timezone |
| Session range | Mark the high and low between 08:00 and 10:00 UTC | Date, hours and available data |
| Time marker | Add a vertical line at 1 July 2025 10:00 UTC | Complete date and label |
| Less prominent drawing | Make the fill of “Study zone” more restrained | Drawing name and intended appearance |
| Interpret a drawing | Explain the two points used for this line | Drawing name or precise chart area |
Begin with one drawing when several marks overlap. Add the other references afterwards and inspect their anchor points.
Find drawings after the exchange
Wait for the final request status, inspect the marks and check the strategy's save state. Return after changing views, or reload to check retained annotations. If the reply is interrupted, inspect the chart as well: drawings may already have arrived. Review these before sending an identical request again.
Show signals, stop and target
Displaying signals is different from creating new entries. Refer to the current strategy and name the items to show.
Show signals for the selected strategy on its chart,
including entry, stop and target when available.
Preserve trading rules and risk settings.
Explain the marks and what is missing if nothing appears.
Check the period, data and chart display settings. A visual mark can explain a signal without being a closed operation in the latest backtest. Use the test journal to confirm observed trades.
Add an indicator to the chart
Specify whether you want a visual study or a strategy condition. For display, include the name, period, price source and optional appearance settings.
Show an EMA 20 based on closes on the strategy chart.
This is a visual aid only: do not change entries or exits.
If that display is unavailable here, explain the settings to use
in the indicator selector.
You can also use the chart controls. Individual labels can be in French or English.
Find and add the study
- Open Indicators / Indicateurs in the chart toolbar.
- Search the full name, such as Exponential Moving Average for an EMA.
- Click the study or its + to add it.
- Check its new legend and plot, then open the study settings offered through its legend.
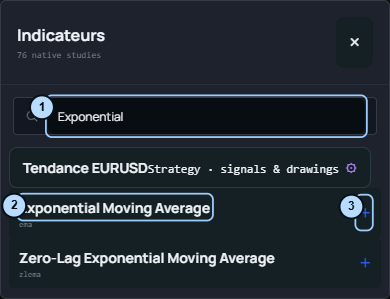
Marks 1, 2 and 3 identify search, the study name and its add control.
Review the settings
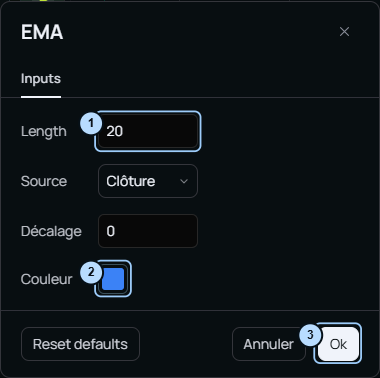
- Parameters: check the study's period and available price source.
- Appearance: colour changes presentation rather than the calculation rule.
- Confirmation: use Ok, then inspect the legend and plot.
A particular phrase cannot make an unavailable study available. Ask for an alternative or the appropriate workflow, then inspect the visual result.
Use an indicator in strategy rules
Showing an EMA does not automatically request an entry above it. Describe the condition's role and how it combines with existing rules.
Add a filter to the current long entry: the completed candle close
must be above EMA 50. Add it to the existing conditions;
do not replace them. Preserve exits, protections and sessions.
Summarise the new combination.
Review the combination in Flow. Being above a value and crossing above it describe different behaviours. See Choose conditions for other measures.
Describe a custom calculation
If your calculation is missing, describe its inputs, observation window and expected cases. Ask for a definition first, then a condition proposal once it is clear.
I want to compare the close with a weighted average of the last
10 completed closes, giving recent closes greater weight.
Before building, clarify the weights, horizon and true/false condition.
Give a simple numerical example and a counterexample.
Identify missing information or data.
Do not describe only “a green signal”; define what makes the condition true. The Flow guide explains where to describe a condition outside the catalogue.
Use a screenshot as a reference
Attach a readable image with symbol and timeframe. Identify your annotations and what you want reproduced. An image does not contain every value or the full history required by a rule.
Study only the marked area in this screenshot.
Describe what is visible, then suggest a measurable rule for returning
inside the zone. List what is missing to test it.
Do not infer win rate or performance from the image.
For a drawing, add: “Represent the zone on the strategy chart if its coordinates and available data allow it; otherwise ask for missing references.” See Share a screenshot for preparation.
Generate code and start compilation
When rules are ready, open Technical area → Code. Depending on the view and account access, the action can read Generate and compile, then Compile again for another generation.
- Save the intended rules and protections.
- Open Code and check the project name.
- Use the generation and compilation action.
- Wait for its final status rather than relying only on a chat statement.
- Inspect status and any diagnostics.
- Review parameters before testing or exporting.
Prepare cTrader code for the selected strategy while preserving its rules.
Identify parameters to review and missing information.
Explain the available compilation status and remaining actions.
Do not present compilation success as a backtest result.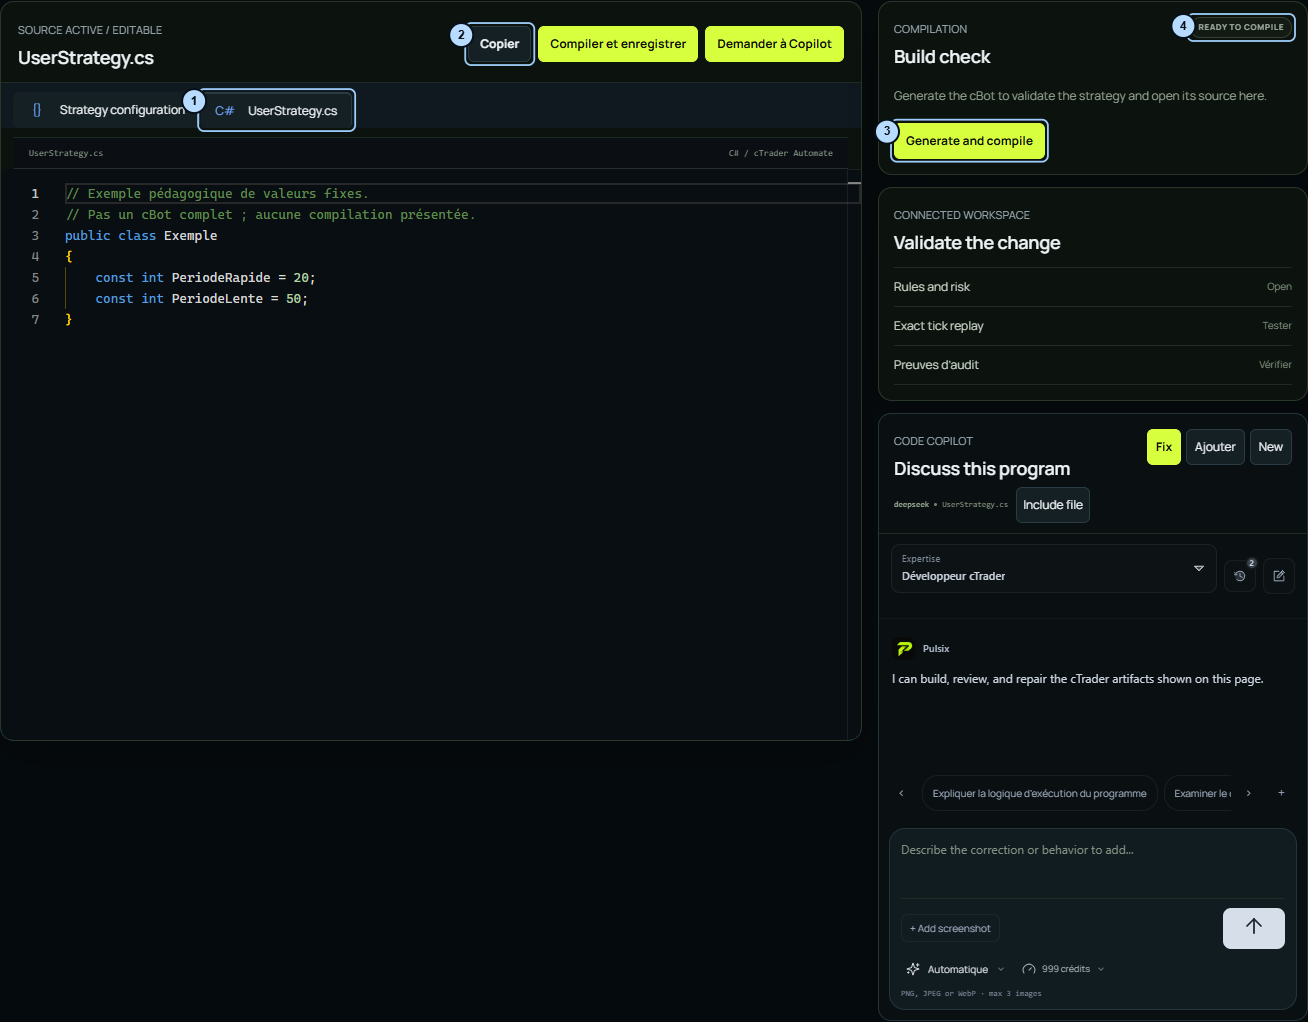
- Active file: select the C# file to inspect.
- Copy: copy the displayed file when access is available.
- Generation / compilation: run the action and wait for status.
- Status: distinguish a pending, successful or failed step in its context.
Copy, edit and retrieve code
In the complete view, select the .cs file and use Copy. Paste into your editor or the appropriate cTrader workflow. Check that it is the intended file and version, rather than configuration data or a truncated preview.
For editable programs, Compiler et enregistrer / Compile and save runs the validation workflow for your changes. Copying text is a separate action. Review status and retained values afterwards.
Use the offered downloads to retrieve a file or package instead of changing its extension. The export guide covers checks after retrieval.
Request a compilation correction
Supply the exact diagnostic, including file and line when shown. In Code Copilot, check the active file and its content-sharing option when available. Fix can prepare a request from the available diagnostic.
Here is the compilation diagnostic for the active file: [paste message].
Explain the probable cause and propose the smallest correction.
Preserve entry conditions, exits, protections and sessions.
After correction, identify the compilation status actually available.
Ask for a missing file or detail instead of inventing its contents.
Start with the first identifiable cause where errors are related. Avoid requesting a full rewrite for a local issue. See Review cTrader code for constants, parameters and compilation checks.
Prepare and run a backtest
Explicitly distinguish opening a view from starting a calculation.
Open backtest for the selected strategy without running it.
Help review symbol, data, period, capital,
spread, slippage and commission before the test.
In Backtest, settings are displayed directly for a first test. When a report is already shown, open Data and test settings to find them. Select data and period, then review Capital and costs. Use Run backtest when the settings are appropriate.
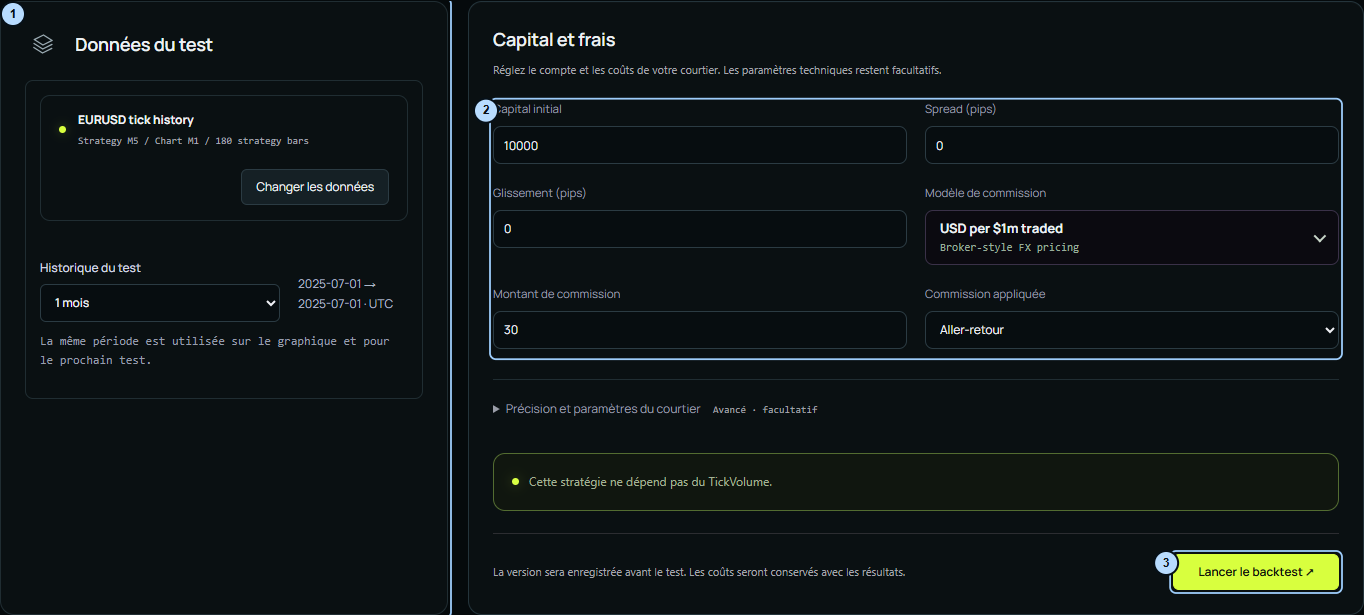
- Data and period: review market context and the selected history.
- Capital and costs: enter relevant values and units.
- Launch: run once and wait for the final status.
Run a backtest of the selected strategy on its associated data,
using the period and costs I have just reviewed.
Do not change any rule or protection.
If data or settings are insufficient, identify what is missing.
A chat request does not prove a calculation started: check operation status and a new report. If it was not triggered or needs more information, use the screen's controls. See Read a backtest for interpretation.
Interpret results and choose an experiment
Analyse the selected strategy's baseline backtest.
Identify version, period, costs and trade count.
Explain net result, drawdown and distribution of wins and losses.
Separate numerical observations from possible explanations.
Suggest one change to compare and a rejection criterion.
Do not fill missing values with unlabelled estimates.
If a conclusion surprises you, ask for an example: “Show a representative loss and explain the entry rule.” Compare the answer with the journal and available data. A convincing explanation does not measure a new parameter's effect.
Keep a baseline, change one item and compare identified tests. Continue with Understand metrics and Compare in AI Lab.
Resume a request and resolve ambiguity
Name a mismatch instead of repeating an ambiguous instruction: “I requested a drawing only; preserve trading rules”, or “Add a filter rather than replace the entry.”
For an interrupted reply, check status, message and credit balance when relevant. Review saved strategy state before repeating a modification. Use offered recovery options and include the displayed identifier when reporting an issue.
Before continuing:
- Correct strategy, market and timeframe?
- Discussion, drawing, change or calculation request?
- Settings to preserve identified?
- Visible outcome and final status checked?
- Next step: review, compile, test or export?
Troubleshooting covers incomplete replies, missing settings, tests without trades and export issues.