
Define the test question
A backtest applies a strategy version to selected historical data with the settings shown in its report. It lets you inspect operations and outcomes within that context. Begin by asking what you want to check.
You might verify an entry rule, measure a cost assumption or compare a variant. Keep those purposes clear: a better net result does not resolve an incorrectly defined entry condition.
Prepare and run
- Select the strategy and save relevant changes.
- Check data and available dates.
- Review capital, currency and cost settings.
- Inspect warnings or missing information.
- Run the test and wait for its final status.
- Identify the version and period in the resulting report.
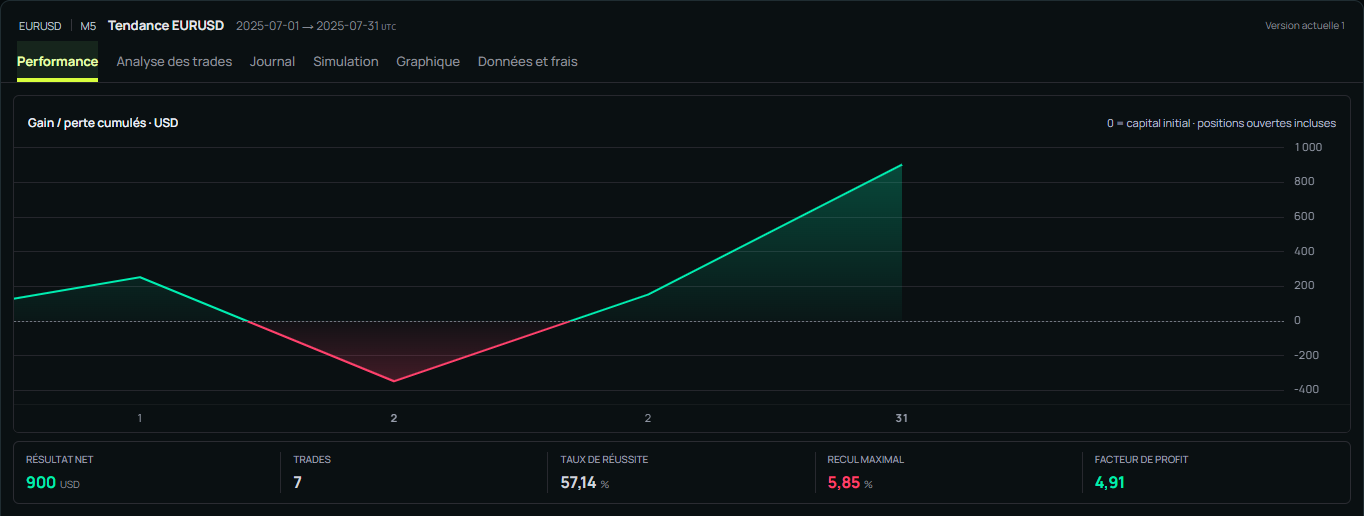
In this demonstration capture, the main line shows the path of cumulative profit or loss. Metrics below it summarise the same test; tabs lead to other views, including the journal and data. These values illustrate the interface, not a recommended strategy.
Read the summary as a whole
| Indicator | What it contributes | What it cannot establish alone |
|---|---|---|
| Net result | Outcome under the retained costs | That the result will repeat |
| Drawdown | Decline observed in the test | A maximum limit for future losses |
| Trade count | Number of observed operations | That observations are independent |
| Win rate | Proportion of winning operations | That average gains compensate losses |
A strong result from few trades needs close inspection. Check whether a handful of exceptional wins explains most of it and what the remaining operations contribute.
Inspect individual trades
Use the trade journal to connect your rules with what the test produced. Review time, direction, entry, exit and net result where available. Compare volume with your risk settings.
Choose varied cases: a win, a loss, a long position, a short position and an event near a session boundary. If a trade surprises you, check the strategy version and data context before changing a rule.
Read the capital curve
The curve shows the path to the result. Look for stagnation, deep declines and concentrated gains. A favourable ending can hide a difficult period in the middle.
Check whether the view represents closed-trade balance or a value including open positions. This distinction can explain differences between a curve, a trade table and a drawdown measure.
Compare baseline and variant
Keep dates, data and costs comparable. If signal, risk and period all change, you cannot attribute the difference to one modification.
Compare these two tests on the same period.
Identify each version, cost settings and trade count first.
Explain differences in net result, drawdown and average gain.
Check whether a few operations explain the difference.
State which comparisons the available information cannot support.
Understand empty or zero results
A completed test with no trades differs from a failed operation. Check compatible conditions, sessions, sufficient history and allowed direction.
An empty metric may be unavailable or impossible to calculate from the current sample. Do not automatically replace it with zero. See Troubleshooting and the metrics reference.